
Category: Visualization
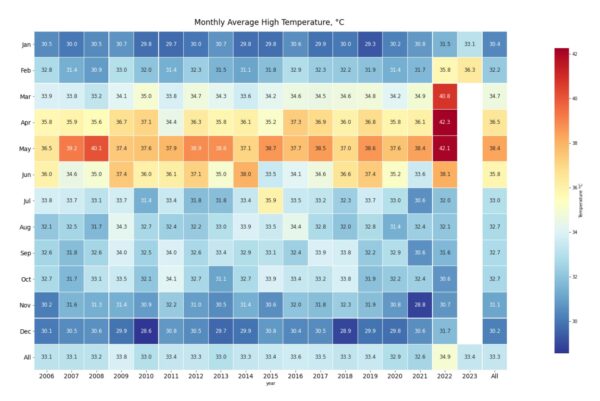
Getting Started with Seaborn : A Beginner’s Guide to Data Visualization in Python
Seaborn is a popular data visualization library in Python that is built on top of Matplotlib. It provides a high-level interface for creating statistical graphics and is particularly well-suited for visualizing distributions, relationships between variables, and other common data exploration…
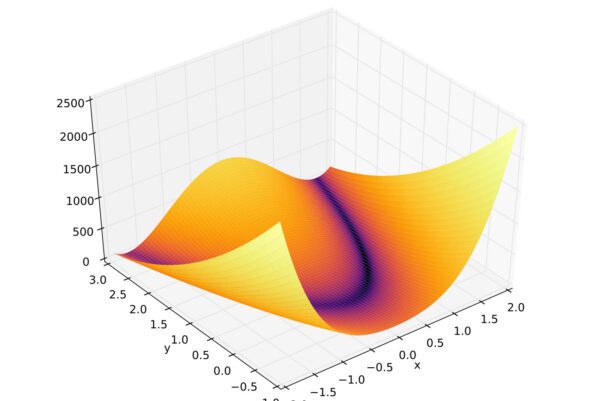
Matplotlib : The Essential Guide for Data Visualization in Python
Matplotlib is a data visualization library in Python that provides an extensive variety of plotting and charting options. It is a plotting library for the Python programming language and its numerical mathematics extension NumPy. Matplotlib provides functions for creating various…