
Seaborn is a popular data visualization library in Python that is built on top of Matplotlib. It provides a high-level interface for creating statistical graphics and is particularly well-suited for visualizing distributions, relationships between variables, and other common data exploration tasks.
Introduction to Seaborn
Seaborn is a data visualization library in Python that provides a high-level interface for creating beautiful and informative visualizations. It is built on top of Matplotlib and provides a number of convenient features that make it easier to create plots and visualize data.
Installation
To get started with Seaborn, you need to install the library by running the following command in your terminal:
pip install seabornOnce you have installed Seaborn, you can import it into your Python script and use it to create visualizations. The basic steps involved in using Seaborn are:
Importing Library
import seaborn as snsLoading Data
Here is a simple example that demonstrates these steps using a built-in dataset in Seaborn:
import pandas as pd
import numpy as np
import seaborn as sns

# Generate random data for total bill, tip, and gender
np.random.seed(0)
total_bill = np.random.randint(10, 50, 40)
tip = np.random.randint(2, 10, 40)
gender = np.random.choice(["Male", "Female"], 40)

# Create a DataFrame with the generated data
tips = pd.DataFrame({
    "total_bill": total_bill,
    "tip": tip,
    "gender": gender
})
This code generates random data for 40 points in the total_bill, tip, and gender columns. It then creates a pandas DataFrame with this data.
Plotting with Seaborn:
There are many different types of plots that you can create with Seaborn, including scatterplots, line plots, bar plots, histograms, and more. Here are a few examples:
- Scatterplot:
sns.scatterplot(x="total_bill", y="tip", data=tips)- Line Plot:
sns.lineplot(x="total_bill", y="tip", data=tips)- Bar Plot:
sns.barplot(x="day", y="total_bill", data=tips)- Histogram:
sns.histplot(x="total_bill", data=tips)Customizing Plots:
Seaborn provides many options for customizing the appearance of your plots, including colors, labels, titles, and more. Here are a few examples:
sns.scatterplot(x="total_bill", y="tip", data=tips, hue="sex")sns.lineplot(x="total_bill", y="tip", data=tips, lw=2)sns.barplot(x="day", y="total_bill", data=tips, palette="Greens")Youtube / Video Tutorials
In this section, we’ll explore some Seaborn tutorials that cover the basics of using Seaborn for data visualization in Python:
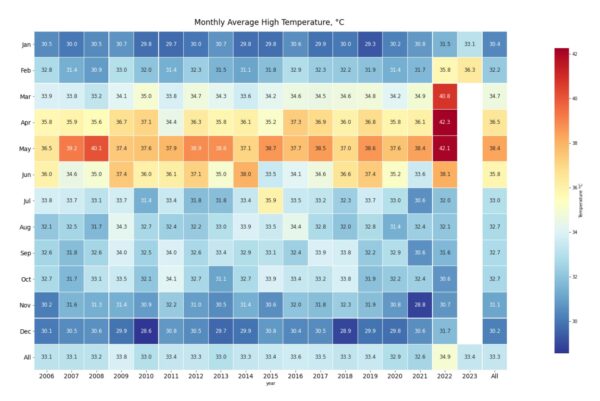
- Seaborn Full Course by Derek Banas: This tutorial provides a comprehensive introduction to Seaborn, covering the basics of data visualization, Seaborn installation, and an overview of the Seaborn library. It also includes examples of creating various visualizations such as scatter plots, line plots, histograms, and heat maps.
- Data Visualization in Python Using Seaborn by Edureka: This tutorial covers the basics of data visualization using Seaborn in Python. It includes an overview of Seaborn, the different types of plots that can be created using Seaborn, and some examples of how to use the library for exploratory data analysis.
- Python graphs: Visualizing With Seaborn by Python graphs: Visualizing With Seaborn: This tutorial covers the basics of data visualization with Seaborn, including creating different types of plots such as scatter plots, line plots, and histograms. It also includes some examples of how to customize the plots and make them more visually appealing.
- Complete Seaborn Crash Course by KGP Talkie: This tutorial covers the basics of data visualization with Seaborn, including creating various types of plots such as scatter plots, line plots, histograms, and heat maps. It also includes some examples of how to use Seaborn for exploratory data analysis and how to customize the plots.
Reference Documentation and Forums
Seaborn. Here are a few that I would recommend:
- The Seaborn documentation: https://seaborn.pydata.org/ – The official Seaborn documentation is an excellent resource that provides a comprehensive overview of the library and its features. It includes tutorials, examples, and detailed explanations of each function and argument.
- DataCamp: https://www.datacamp.com/community/tutorials/seaborn-python-tutorial – DataCamp provides a variety of tutorials and exercises on Seaborn, as well as many other data science and machine learning topics.
Reference Technical Books
If you prefer to learn by reading books, here are a few books on Seaborn that you might find useful:
- “Data Visualization with Seaborn” by Martin B. Hocking, Packt Publishing, ISBN-13: 978-1800567718 This book provides a comprehensive guide to data visualization using Seaborn. It covers all the basics of data visualization, including data types, data structures, and visualization tools. The book also covers more advanced topics like working with data frames, creating customized visualizations, and exploring big data with Seaborn.
- “Seaborn: Beautiful Plots with Python” by Jonathan Balaban, Packt Publishing, ISBN-13: 978-1789131515 This book provides a comprehensive guide to data visualization using Seaborn. It covers the basics of working with Seaborn, including data structures, visualization tools, and plotting methods. The book also covers more advanced topics like creating customized visualizations, exploring big data with Seaborn, and working with complex datasets. The book includes many practical examples and real-world use cases to help you master the art of data visualization using Seaborn.
- “Python Data Science Handbook: Essential Tools for Working with Data” by Jake VanderPlas, O’Reilly Media, ISBN-13: 978-1491912058 This book provides an overview of the entire Python data science ecosystem, including Seaborn. It covers the basics of working with data in Python, including data manipulation, data cleaning, and data visualization. The book also covers more advanced topics like machine learning and big data analysis.
Conclusion
Whether you are a beginner or an experienced data scientist, there are many resources available to help you learn and master Seaborn. The official documentation and community forums are great places to start, and there are also many tutorials and online courses available. Additionally, the recommended books provide in-depth coverage of Seaborn’s features and capabilities.
Overall, Seaborn is a valuable tool for anyone who works with data in Python, and it is well worth exploring for its potential to create beautiful and informative visualizations.
