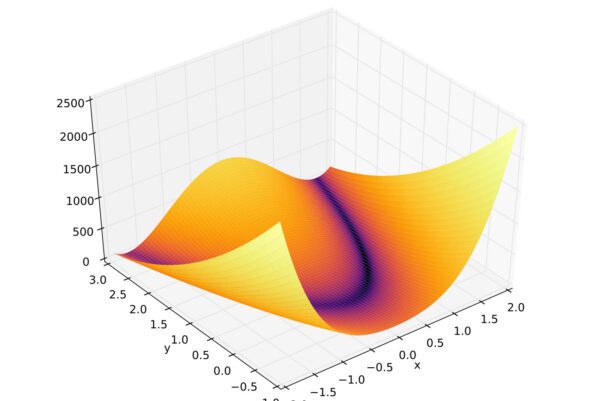
Matplotlib is a data visualization library in Python that provides an extensive variety of plotting and charting options. It is a plotting library for the Python programming language and its numerical mathematics extension NumPy. Matplotlib provides functions for creating various types of plots, including line plots, scatter plots, bar plots, error bars, histograms, bar charts, pie charts, box plots, and more. The library has a rich set of customization options and supports various file formats for exporting plots. Additionally, Matplotlib integrates well with other popular Python libraries such as pandas and seaborn, making it an essential tool for data analysis and visualization. With its simple yet powerful interface and its ability to produce high-quality plots, Matplotlib is a popular choice for data scientists, researchers, and engineers.
Installation
To use Matplotlib, you first need to install it. You can install it using pip by running the following command:
pip install matplotlibImporting Matplotlib
Once you have installed Matplotlib, you need to import it in your Python script to use it. You can import it using the following line of code:
import matplotlib.pyplot as pltPlotting a Line Plot
import matplotlib.pyplot as plt

# x-axis values
x = [1, 2, 3, 4, 5]

# y-axis values
y = [2, 4, 1, 5, 3]

# Plotting the line plot
plt.plot(x, y)

# Adding a title to the plot
plt.title("Line Plot Example")

# Adding labels to the x-axis and y-axis
plt.xlabel("X-axis")
plt.ylabel("Y-axis")

# Displaying the plot
plt.show()
This will create a line plot with the x-axis values on the bottom and the y-axis values on the left. The title of the plot is “Line Plot Example” and the x-axis is labeled “X-axis” and the y-axis is labeled “Y-axis”.
Plotting a Scatter Plot
Another type of plot you can create using Matplotlib is a scatter plot. A scatter plot is used to visualize the relationship between two variables. To create a scatter plot, you need to provide two arrays: one for the x-axis values and one for the y-axis values.
import matplotlib.pyplot as plt

# x-axis values
x = [1, 2, 3, 4, 5]

# y-axis values
y = [2, 4, 1, 5, 3]

# Plotting the scatter plot
plt.scatter(x, y)

# Adding a title to the plot
plt.title("Scatter Plot Example")

# Adding labels to the x-axis and y-axis
plt.xlabel("X-axis")
plt.ylabel("Y-axis")

# Displaying the plot
plt.show()
This will create a scatter plot with the x-axis values on the bottom and the y-axis values on the left. The title of the plot is “Scatter Plot Example” and the x-axis is labeled “X-axis” and the y-axis is labeled “Y-axis”.
Plotting a Bar Plot
A bar plot is used to represent categorical data. To create a bar plot, you need to provide two arrays: one for the x-axis values (categories) and one for the y-axis values (data).
import matplotlib.pyplot as plt

# Categories
categories = ['A', 'B', 'C', 'D', 'E']

# Data
data = [2, 4, 1, 5, 3]

# Plotting the bar plot
plt.bar(categories, data)

# Adding a title to the plot
plt.title("Bar Plot Example")

# Adding labels to the x-axis and y-axis
plt.xlabel("Categories")
plt.ylabel("Data")

# Displaying the plot
plt.show()
This will create a bar plot with the categories on the x-axis and the data on the y-axis. The title of the plot is “Bar Plot Example” and the x-axis is labeled “Categories” and the y-axis is labeled “Data”.
Plotting a Histogram
A histogram is used to represent the distribution of numerical data. To create a histogram, you need to provide an array of numerical data.
import matplotlib.pyplot as plt

# Data
data = [2, 4, 1, 5, 3, 2, 4, 3, 2, 4, 1, 5, 2, 4, 2, 4, 1, 5, 3, 2, 4, 1, 5, 3, 2, 4, 1, 5, 3]

# Plotting the histogram
plt.hist(data, bins=10)

# Adding a title to the plot
plt.title("Histogram Example")

# Adding labels to the x-axis and y-axis
plt.xlabel("Data")
plt.ylabel("Frequency")

# Displaying the plot
plt.show()
This will create a histogram with the data on the x-axis and the frequency on the y-axis. The title of the plot is “Histogram Example” and the x-axis is labeled “Data” and the y-axis is labeled “Frequency”. The bins parameter in the hist function is used to specify the number of bins in the histogram.
Youtube / Video Tutorials
Here are some popular YouTube videos on Matplotlib that you may find helpful:
Matplotlib is a popular data visualization library in Python. It allows you to create a variety of plots, charts, and graphs to visualize your data in a meaningful way. Here are some useful tutorials to get started with Matplotlib:
- Matplotlib Tutorial (2020) – This tutorial is a comprehensive guide to using Matplotlib for data visualization. It covers everything from creating basic plots to advanced customization techniques, and includes a range of examples to help you understand the concepts. The tutorial is suitable for both beginners and advanced users.
- Python Matplotlib Tutorial (Part 1): Creating and Customizing Our First Plots – This tutorial is a part of a series of tutorials on Matplotlib by Corey Schafer. In this video, he covers the basics of creating a plot using Matplotlib, customizing the plot, and adding labels, titles, and legends. The tutorial is aimed at beginners who want to learn the basics of Matplotlib.
- Data Visualization with Matplotlib and Python – This tutorial is a comprehensive guide to using Matplotlib for data visualization, including the use of Pandas for data analysis. It covers a range of topics, including line plots, scatter plots, histograms, bar charts, and more. The tutorial is suitable for beginners who want to learn the basics of data visualization using Matplotlib.
- Python Matplotlib Tutorial by Edureka – This tutorial is a comprehensive guide to using Matplotlib for data visualization. It covers the basics of creating plots, customizing plots, and adding annotations. It also covers advanced topics like subplots, 3D plotting, and animations. The tutorial is suitable for beginners who want to learn the basics of Matplotlib and advanced users who want to learn advanced techniques.
Overall, these tutorials are useful resources for learning how to use Matplotlib for data visualization in Python.
Reference Documentation and Forums
- Matplotlib Official Documentation: https://matplotlib.org/stable/contents.html The official Matplotlib documentation is the best starting point for learning how to use the library. It covers everything from installation to advanced customization and includes examples and tutorials.
- Matplotlib API Reference: https://matplotlib.org/stable/api/index.html The Matplotlib API Reference is a comprehensive guide to all the functions, classes, and methods available in the library. It provides detailed information on how to use Matplotlib’s features and includes example code.
- Matplotlib Gallery: https://matplotlib.org/stable/gallery/index.html The Matplotlib Gallery is a collection of examples and code snippets that demonstrate the power and versatility of the library. It includes a variety of plots, charts, and graphs for different use cases, as well as the code used to create them.
- Matplotlib Users Mailing List: https://mail.python.org/mailman/listinfo/matplotlib-users The Matplotlib Users Mailing List is a forum where users can ask questions, report issues, and share insights and tips related to using the library.
- Matplotlib GitHub Repository: https://github.com/matplotlib/matplotlib The Matplotlib GitHub Repository is the source code for the library. It includes the latest version of the library, as well as issue tracking, documentation, and community contributions.
Reference Books
Here are some recommended books for learning and using Matplotlib:
- “Python Plotting with Matplotlib” by Ben Root, Apress, 2019. ISBN-10: 1484241665, ISBN-13: 978-1484241660. This book provides a comprehensive guide to using Matplotlib for data visualization in Python. It covers basic plotting techniques, customizing plots, working with axes and subplots, and creating animations. The book is suitable for readers with basic knowledge of Python and is filled with examples and hands-on exercises.
- “Data Visualization with Python and Matplotlib” by Justin Bois, O’Reilly Media, 2021. ISBN-10: 1492047106, ISBN-13: 978-1492047107. This book covers the basics of data visualization with Matplotlib in Python. It starts with the basics of plotting data and progresses to more advanced techniques such as 3D plotting and using Matplotlib with other libraries. The book also includes topics on creating interactive visualizations and making publication-quality plots.
- “Python Data Science Handbook: Essential Tools for Working with Data” by Jake VanderPlas, O’Reilly Media, 2016. ISBN-10: 1491912057, ISBN-13: 978-1491912058. While this book is not solely focused on Matplotlib, it is an essential reference for anyone working with data in Python. The book covers the basics of Matplotlib and includes examples of how to use it in conjunction with other data science tools such as NumPy and Pandas.
- “Mastering matplotlib” by Duncan M. McGreggor and Paul Ivanov, Packt Publishing, 2015. ISBN-10: 1783987545, ISBN-13: 978-1783987542. This book provides an in-depth guide to mastering the advanced features of Matplotlib for creating highly customizable plots. It covers various topics such as 3D plotting, color maps, animation, and interactive plots. The book is suitable for readers with prior experience in using Matplotlib.
Conclusion
In this article, we covered some basic concepts of using Matplotlib to create plots and visualizations. We covered line plots, scatter plots, bar plots, and histograms. With these basic building blocks, you can create more complex visualizations and analyze your data.


